16 Beautiful Graphs and Charts for Angular JS
JavaScript charting libraries have emerged as the most powerful tools for visualizing data in the form of beautiful, easy to understand, interactive charts. They make it easier to extract and convey key patterns and insights that are often not apparent with static charts.
In this article, I will show you 16 Beautiful Graphs and Charts for Angular JS. These libraries will help you create beautiful and customizable charts for your future projects.
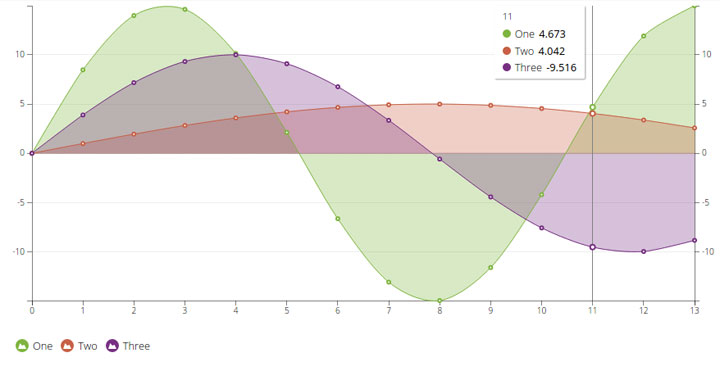
1 – AngularJS Directive For NVD3 Reusable Charting Library
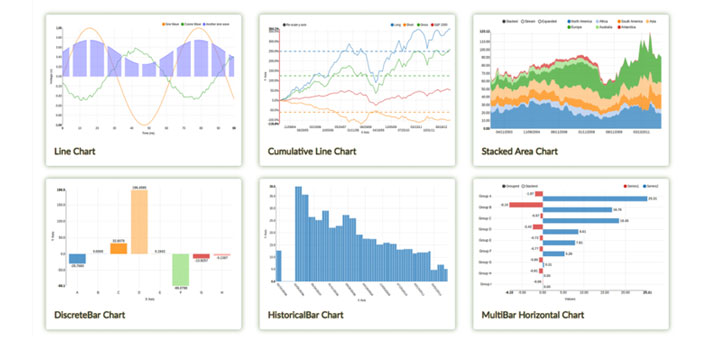
This thing is designed to make it easier to work with nvd3.js re-usable charting library. This directive allows you to easily customize your charts via JSON API.
The key feature is that the original hierarchical structure of nvd3 models is completely preserved in directive JSON structure. This means that while you creating a complex chart that containing multiple elementary chart models (such as line, bar,axis, …), you can in turn customize the properties of each internal elementary models as well as the global charting properties the way you want. This can be done as usual, but it becomes quite easily to customize while applying JSON approach to.
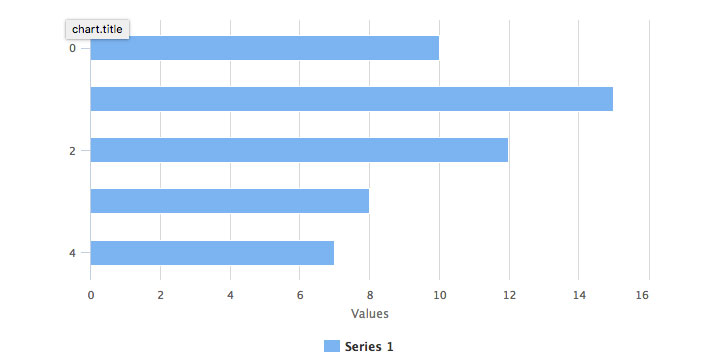
2 – AngularJS using Chart.js
Beautiful, reactive, responsive charts for Angular.JS using Chart.js.
3 – Angular Google Chart
Google Chart Tools AngularJS Directive Module
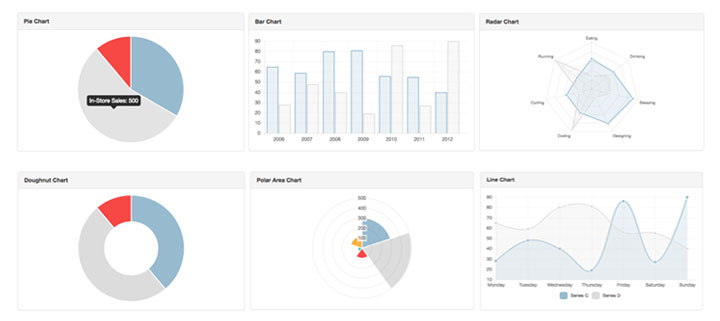
4 – tc-angular-chartjs
Add Chart.js to your angular applications
tc-angular-chartjs provides you with directives for all chartjs chart types.
- Line Charts
- Bar Charts
- Radar Charts
- Polar Area Charts
- Pie Charts
- Doughnut Charts
5 – Angular-chartist.js
Angular directive for Chartist.js
6 – Angular Morris Chart
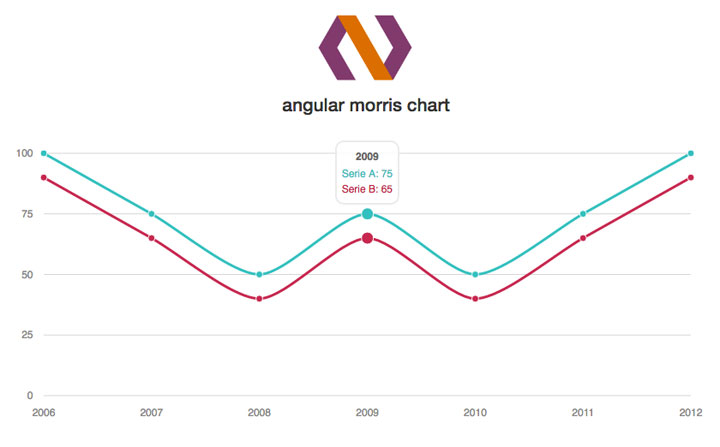
A module with directives to easy use of morris with angular
7 – Angular Chart
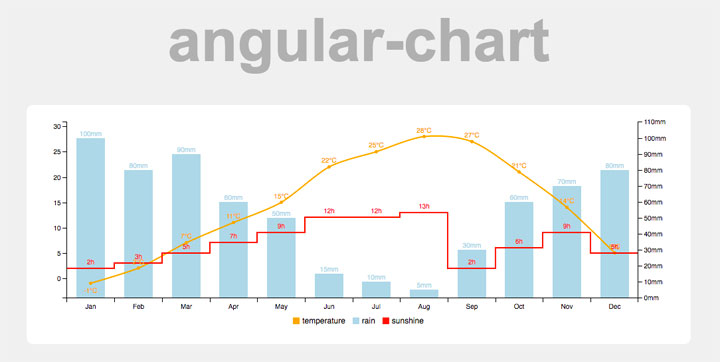
angular-chart is a AngularJS directive, which is build on top of C3.js a d3-based chart library.
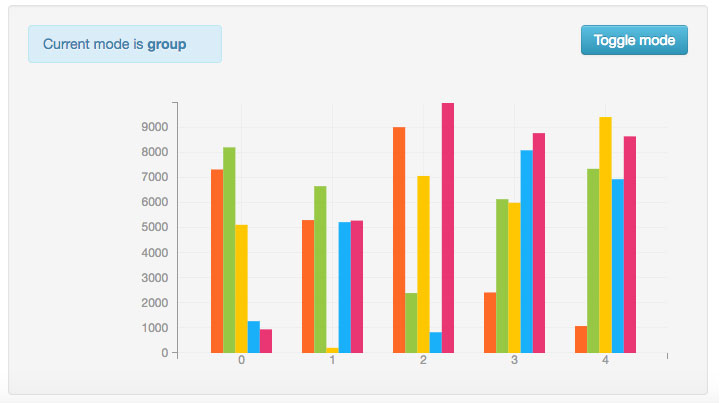
8 – ZingChart-AngularJS
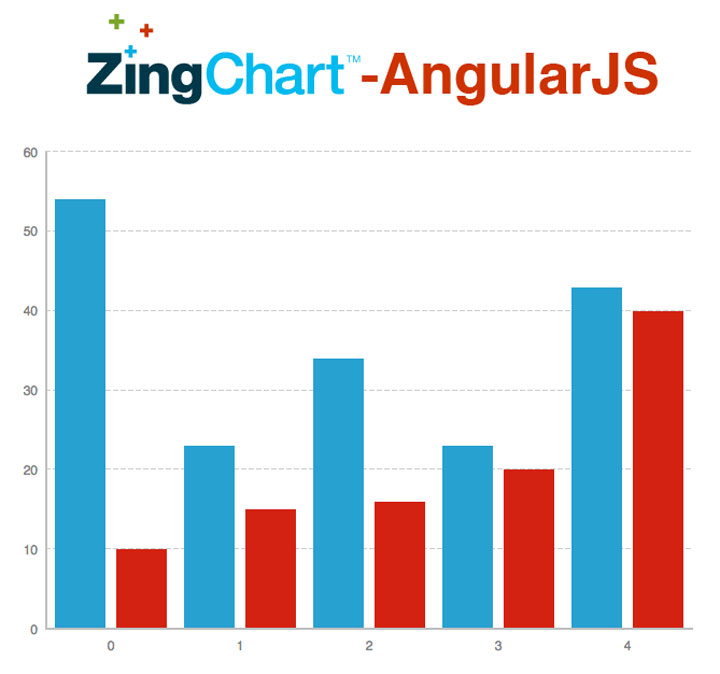
An AngularJS directive for ZingChart to make your charts work dynamically with your data.
9 – Lightweight Gauge / Doughnut Chart For AngularJS
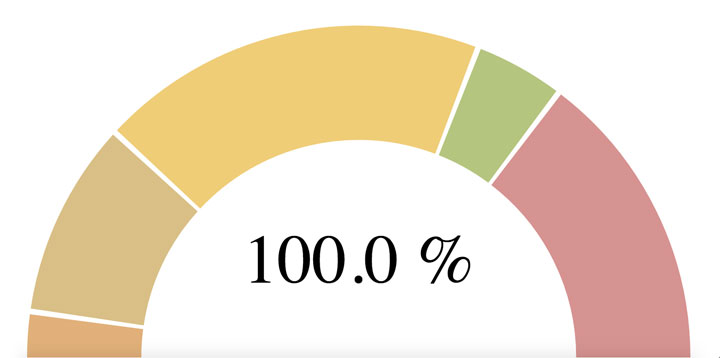
This is a small Angular-Directive for plain SVG gauges/doughnut charts.
10 – Nested Pie Chart Control With Angular
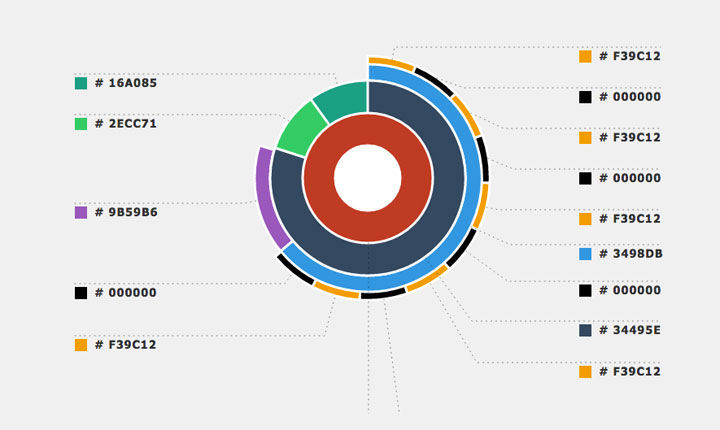
A nested pie chart control with angular bound data composed as a single SVG
11 – Angular Flow Charts
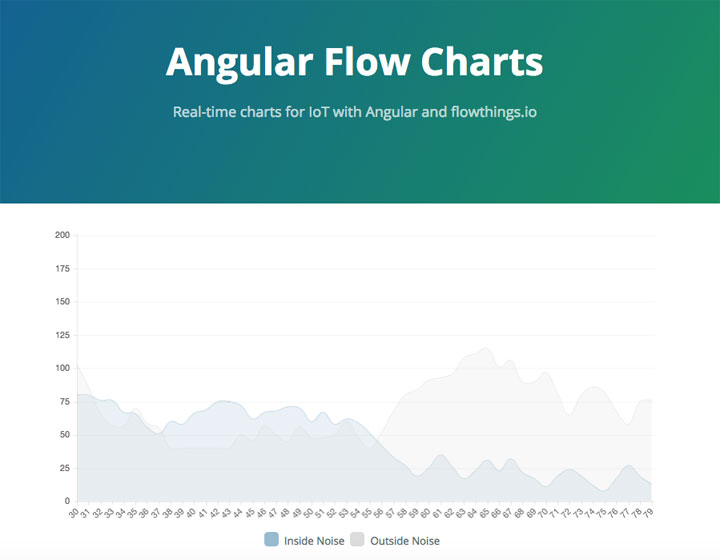
Real-time charts for IoT using angular and flowthings.io. Uses the official flowthings angular client for communication with flowthings.io server.
12 – Angular Smart Chartist
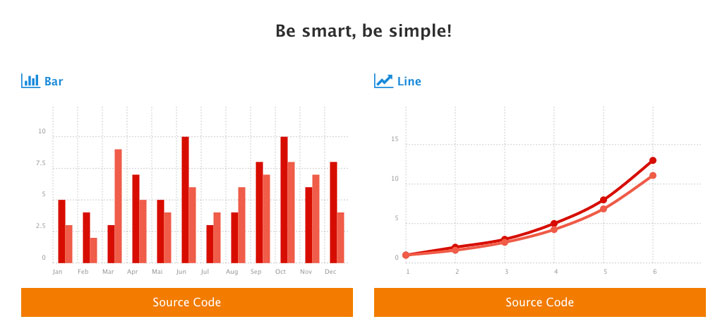
A handy direcitve for chartist, by which developer can build up their application with a beautiful chart in it
13 – n3-line-chart
n3-line-chart is an easy-to-use JavaScript library for creating beautiful charts in AngularJS applications and it is built on top of D3.js.
14 – AngularJS directive for Highcharts
A simple Angularjs directive for Highcharts.
15 – Angular-FusionCharts
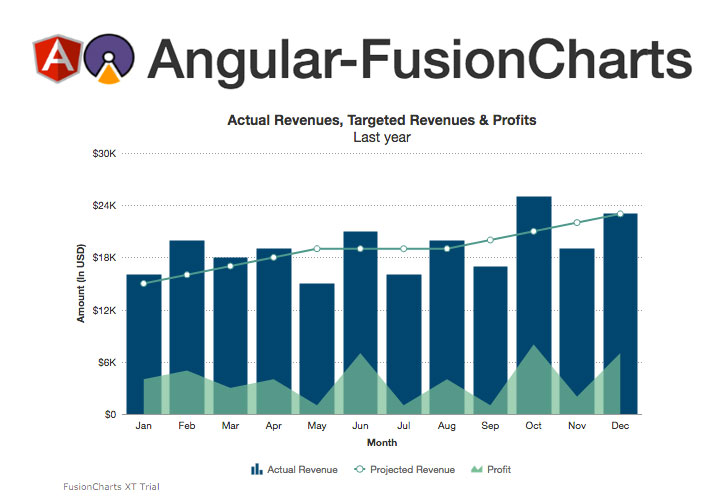
Use this AngularJS charts plugin to add interactive charts to your web and mobile applications using just a single directive. Choose from 90+ charts & 900+ maps from FusionCharts’ core JavaScript charts library.
You can access all the rich charting features like events, annotations, macros, themes, image-export etc. to make your visualizations stand-out.
16 – viz
Graphs & visualization widgets built using AngularJS and D3.js


 Review and analytic your site
 Lookup your IP
 Reciprocal link checker
 List old Pop Disks
 List health tools
 Frameworks, libraries, softwares and resources Network